
March 21, 2024 - LSTA secondary loan trading volume increased 2% month-over-month in February to an 11-month high of $67.2 billion. Better still, volumes have averaged $66.6 billion over the first two months of the year, or 12% higher than their LTM average – a welcoming trend considering that annual volumes slipped more than 13% last year. Alongside the higher January and February volumes were tighter bid-ask spreads, with the median bid-ask spread on the traded universe of loans declining 10 basis points to a two-year low of 50 basis points. While spreads ran tighter, traders continued to cast a wider net across the secondary as monthly market breadth (i.e., the number of distinct loan facilities traded) remained robust – at more than 1,525 loans traded. Prior to this year, monthly market breadth had only exceeded 1,500 loans once since 1Q23.
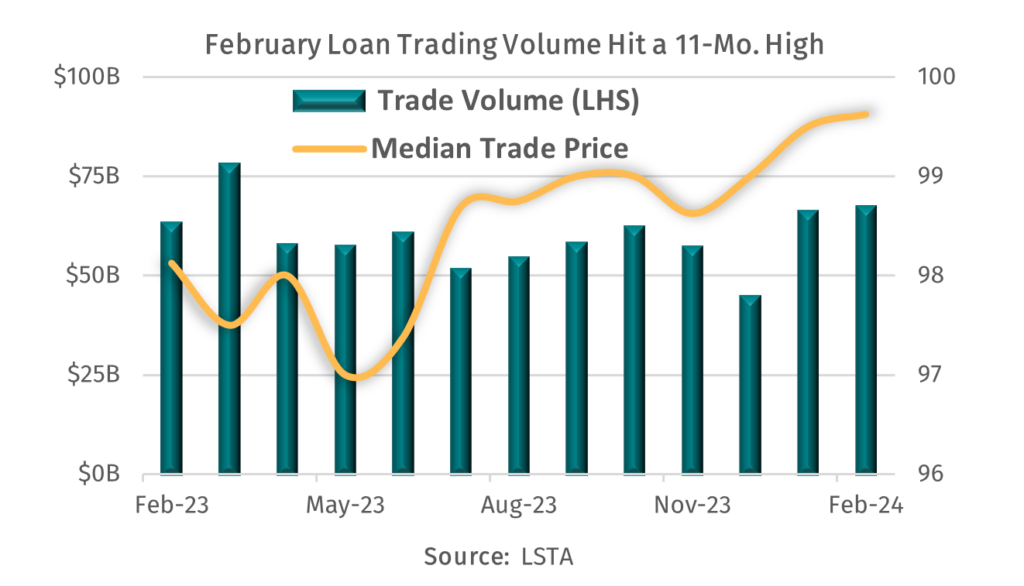
Following a brief pullback in January trading levels (due in part to the near-record refinancing and repricing wave that sent new loan yields lower), traders turned bullish yet again in February as advancers outpaced decliners by a ratio of 2:1 in the secondary. In turn, trading levels increased to multi-year highs as the average price shot up 67 basis points to 96.95, while the median price hovered around 99.5 – or just 50 basis points shy of par. With that said, the secondary market became less frothy in February as the percentage of trading activity in a par-plus price range fell nine percentage points to “just” 32%. Of course, February’s more subtle refinancing activity took out some of those loans that had been trading above par. In turn, the percentage of trade activity in the 98-par price range increased proportionally – to 39% from 30%. Combined, the 98-and- greater price range represented 72% of total volume but 78% of total outstandings. This mismatch makes sense given that the stressed side of the market has not only outperformed this year but also has become more active in the secondary. Case in point, trade activity within the sub-90 price range represented 12% of trading volume but accounted for less than 8% of total outstandings.
So what drove secondary activity and price levels higher in February? Well, it all started with technicals of course, where a bout of M&A activity led to a $10 billion increase in Morningstar LSTA Leveraged Loan Index outstandings (LLI). February marked the first time in five months that the tradable universe of loans expanded, providing a much-needed reprieve to a red-hot CLO market that priced almost $15 billion in deals during the month. While small in comparison but meaningful from a real-time liquidity perspective, retail loan funds added to the technical mismatch in February by raking in a three-month-high $480 million of inflows. And as we look ahead, visible demand levels should remain robust with several banks upping their full-year CLO issuance targets and the Fed announcing that it would not be raising interest rates just yet.