April 7, 2022 - As expected, 1Q22 loan and CLO issuance slowed and spreads widened due to a disruptive exogenous shock. Less expected was that the shock came not from the end of LIBOR, but rather from Russia’s invasion of Ukraine.
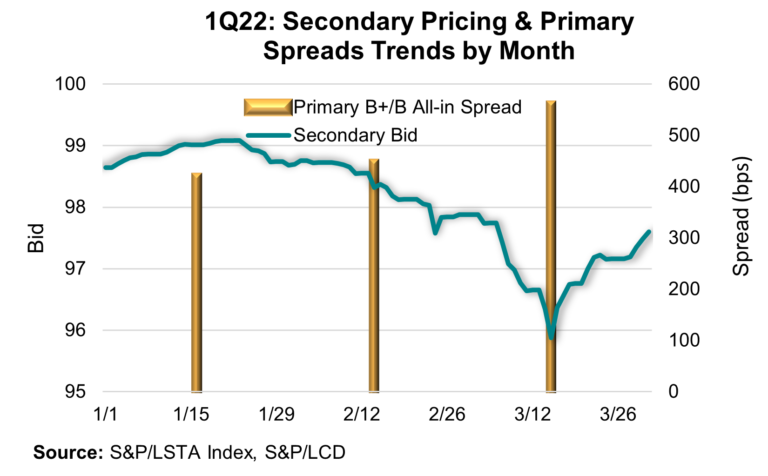
Indeed, 2022 started out on a positive note. Having been trialed in December, the LIBOR transition moved relatively smoothly for loans. LFI reported that institutional lending started the year strong, with $50 billion of priced institutional loans (and nearly all – save a few incrementals – based off Term SOFR). Terms were relatively favorable for borrowers in early Q1 as well. Secondary market prices in the S&P/LSTA Loan Index climbed above 99 by mid-January. Meanwhile, primary pricing was dominated by spread trimming, with 22 reverse flexes to 1 upward flex, LevFinInsights (LFI) reported.
While loans started in a sprint, the CLO market was slower out of the gate because issuers and investors needed to get their heads around a SOFR pricing model. Pricing dust-ups settled out in mid-January; unlike the initial flurry of loans, CLOs included SOFR spread adjustments directly in the margins. A sneak peek at Refinitiv LPC’s Leveraged Loan Monthly shows that January’s SOFR CLO AAA margins (131 bps) were averaging about 19 bps higher than December’s LIBOR CLO AAA margins (122 bps). That sorted, CLO pricings got going; nevertheless, with their slower start, January’s issuance totaled less $5 billion, LCD wrote.
January’s strong start for loans moderated in February amid interest rate volatility imported from other markets and, of course, Russia’s threatened (and then executed) invasion of Ukraine. Secondary prices in the S&P/LSTA Index slid below 98 by late February, LFI’s 13 reverse-flexes were largely balanced by 11 upward flexes and LCD’s all-in B+/B spreads over SOFR climbed from 420 bps in January to 447 bps in February. Meantime, LFI’s new priced volumes edged down to $47 billion. On the flip side, CLO activity had been gaining momentum and enjoyed $14 billion of new issuance in February and AAA spreads (132 bps) that were consistent with January levels.

Things worsened in March, before seeing some recovery around quarter-end. With war afoot in Europe, new issue activity contracted. LFI’s priced volume dropped below $20 billion and flexes turned sharply upward (4 down, 17 upward). LCD’s all-in B+/B institutional loan spreads (which include OIDs) gapped more than 100 bps to 560 bps. And CLOs felt it as well. LCD’s volumes dropped to $11 billion, with deals often offering some concessionary features to clear. Pricing also widened: Refinitiv LPC’s CLO AAA spreads climbed to 139 bps and Deutsche Bank noted that discount margins were not being released.
As yields widened, documentation tightened. Covenant Review noted that while deal flow was scarce in March, covenant changes were meaningful on loans that cleared. Documentation scores tightened to an average of 3.73 in March from 4.00 in February (on a scale of 1 (tightest) to 5 (loosest)). And the changes were widespread: fewer than a quarter of cleared deals saw no change in documentation.
That said, things began to turn around in the latter days of March. After bottoming out below 96 in mid-March, secondary prices rebounded to 97.6 by the end of the month and topped 98 as of April 6th. Similarly, LFI saw no deals reverse flex from March 1st to 23rd, but at least four loans did so in the final eight days of the month.
Still, when the months are added together, the resulting first quarter loan stats are uninspiring: According to LCD, both institutional and pro rata leveraged volumes were below last quarter and last year’s levels. Secondary loan prices ended the quarter down more than a point and, at -0.1%, S&P/LSTA Loan Index returns were marginally negative. Still, it could have been much worse. At least loans were cushioned by rising interest rates. In contrast, as noted in the LSTA’s Secondary Market Monthly, high yield bonds – which suffer when rates rise – returned -4.6% for the quarter. And, as reported by Refinitiv LPC, there was little demand for or supply of those assets: Bond funds saw $26 billion in outflows and bond issuance tumbled 70% year-over-year. If loans didn’t have positive returns, at least they had schadenfreude.


