July 13, 2022 - A recent proposed change in NAIC risk based capital (RBC) for CLOs has provoked lively debate around i) whether CLOs suffer fewer losses than other asset classes and ii) if so, why? After drilling into the literature and data, it’s clear that CLOs have seen lower losses than equivalently-rated corporate debt andsecuritized products since their inception. But why? We believe there are several reasons. First, foundationally, CLO loan portfolios themselves may outperform passive portfolios of equivalently rated assets. Then, in addition to a potentially better performing loan portfolio, there are the structural protections and enhancements of the CLO itself. We dissect the arguments and review the data below.
Let’s start with the portfolio. Unlike an index or a generic portfolio of loans, a CLO manager actively manages the portfolio, but also is simultaneously constrained by built-in tests that control the quality of the CLO’s underlying assets. This combination of active management and collateral quality tests should help optimize CLO portfolios, which should tend to have less credit risk than the loan market overall.
CLO managers must meet three interconnected collateral quality tests: (i) a Weighted Average Rating Factor Test (WARF), which requires the loans to have a certain minimum rating; (ii) a Weighted Average Spread Test (WAS), which requires the loans to have a certain minimum spread over the base rate applicable to the liabilities; and (iii) a Diversity test, which requires the CLO to maintain a certain level of industry and “single-name” issuer diversification. The combination of these three tests provides guardrails that require the manager to select credit risks that are designed to maintain a stable CLO portfolio.

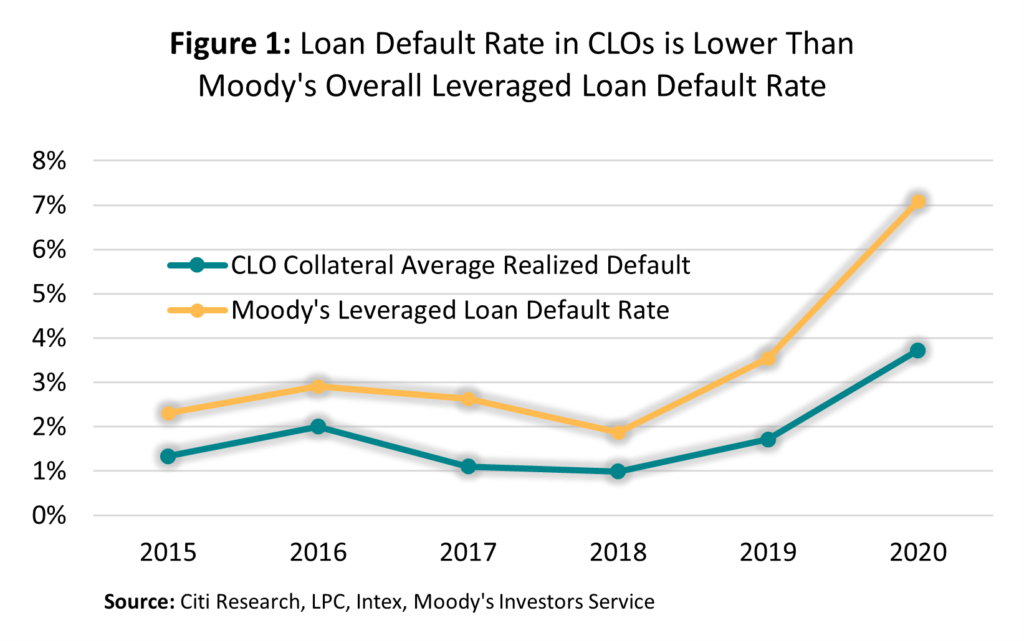
In addition, because the manager can purchase well-performing assets at below face value that are expected to ultimately be repaid at full face value, managers are able to build the value of the CLO portfolio over time. This typically counterbalances credit losses experienced in a portfolio. In contrast, an unmanaged portfolio of loans would generally lose more value over time as it passively absorbs credit losses. The outperformance of CLO portfolios vs unmanaged or lightly managed loan portfolios can be observed in the Figure 1, which compares the share of defaulted loans in CLOs to the Moody’s Leveraged Loan Default Rate. By actively managing their portfolios and selling underperforming loans before they default – usually at prices well above assumed recovery rates – CLO managers have far fewer defaulted loans in their CLO portfolios compared to the overall loan market. (The fact that CLOs must carry defaulted assets at punitive values incentivizes this behavior by managers.)
Next, the CLO structure – with its embedded enhancements – adds another layer of protection on top of the managed (but constrained) portfolio. CLOs contain Overcollateralization (“OC”), Interest Coverage (“IC”) and Interest Diversion tests that provide protections to the liabilities. The OC test assesses the par value of the underlying loan collateral against the value of the CLO debt tranches. If it fails the OC test, the debt tranches of the CLO (from the most senior tranche downward) are paid down until the test comes back into compliance. The IC tests works similarly – the interest paid by the loan collateral is tested against the interest payable on the CLO debt tranches and the debt repayment follows the same mechanism to reduce the more senior debt tranches until the test is cured. Thus, these tests protect the CLO structure by forcing a deleveraging if a breach occurs. The Interest Diversion test requires that interest proceeds be reinvested into purchasing additional loan collateral, thus increasing the value of the collateral relative to the CLO liabilities. These protective attributes reduce the credit risk of the CLO liabilities relative to the collateral pool.
In addition, CLOs rely on subordination to provide yet another layer of protection to debt tranches. Analysts have modeled many variations of default/recovery scenarios on CLOs to determine the “breakeven” default rate – in other words, the level of defaults required to create a first dollar of impairments for different CLO debt tranches. For example, in its Global Securitized Products Mid-Year Outlook, Morgan Stanley analysts calculated that assuming a 15% constant payment rate, 60% recovery rate, no call and reinvestment of assets at current Weighted Average Spread (WAS) levels, the median BB note across vintages is capable of withstanding 7% defaults per year for the life of the CLO investment, which can be as long as 10 years.

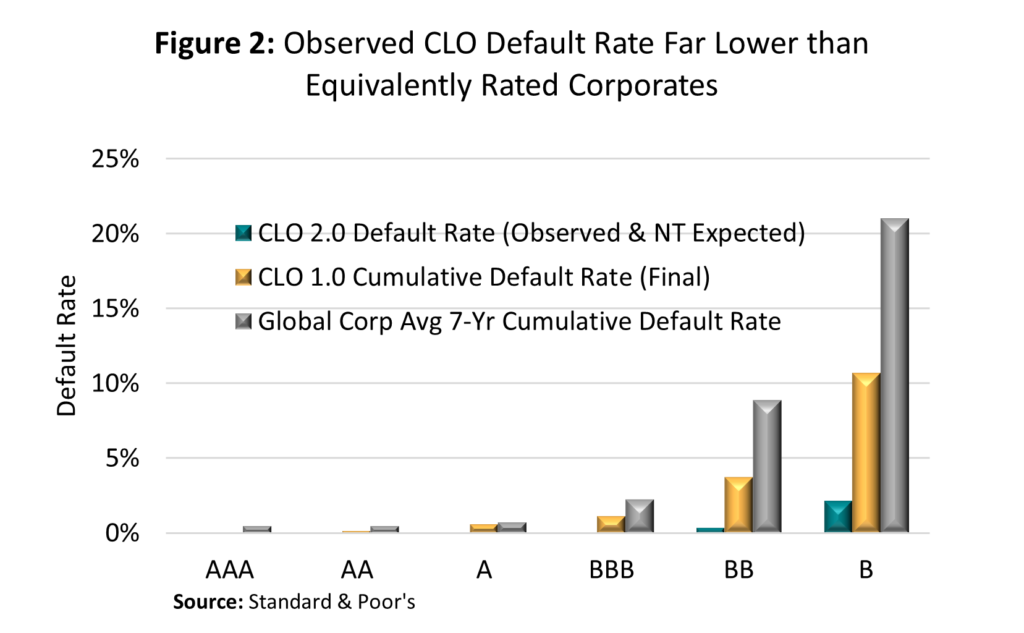
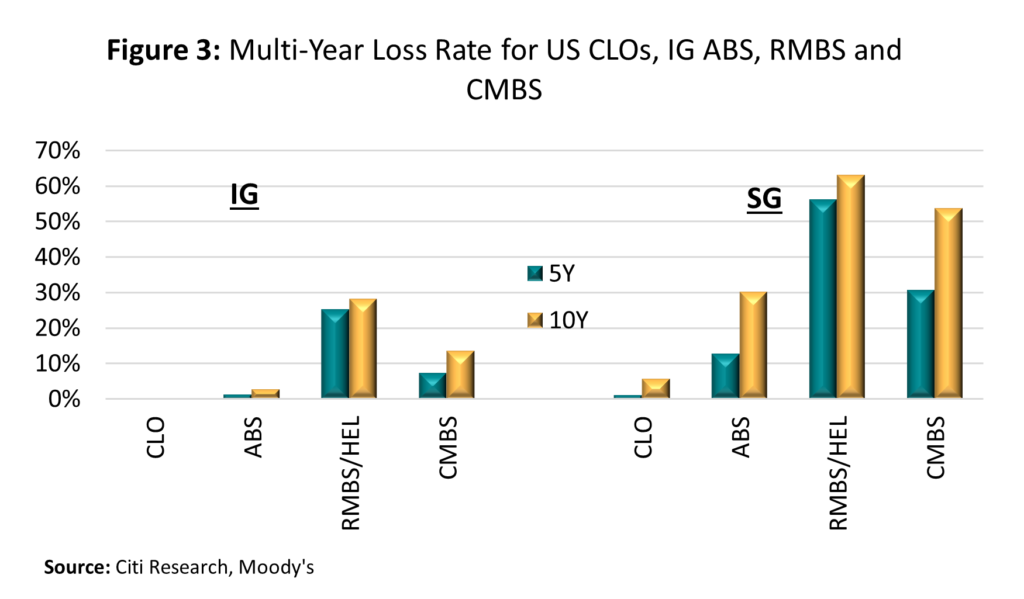
So, does the “lower risk” thesis show up in the performance numbers? In fact, it does. CLO notes suffer lower losses than either equivalently-rated corporate debt or other securitized products. S&P has rated more than 16,000 CLO tranches totaling around $1.2 trillion. Whether looking at 1.0 CLOs or 2.0 CLOs (whose default rates are not final), their default rates are a fraction of those seen in corporate debt. Of the 4,322 rated 1.0 CLO notes, just 40 defaulted – or a cumulative default rate of less than 1%. Of the 12,244 rated 2.0 CLO tranches, just 10 had defaulted as of March 2022 – or a cumulative, but not final, default rate of 0.08%. At every level of rated CLO notes and equivalent corporate bonds, 1.0 CLO default rates – which are final and fixed – are a fraction of corporate bond default rates (Figure 2). In fact, at their highest, CLO tranche default rates are half that of equivalently rated corporate bonds. This suggests that NRSRO ratings assigned to CLOs may be conservative when compared to single-exposure corporate credit ratings and investors are more likely to recover their investment in CLOs than if they invested in equivalently-rated corporate debt. The same is true when CLOs are compared to ABS, RMBS and CMBS. Whether looking at investment grade or speculative grade debt, CLO losses are well below those of other securitized products (Figure 3).
We posited above that CLOs outperform their equivalently rated peers. We think the data bears this out. Ultimately, the active management and collateral quality constraints of the CLO portfolio and the structural protections in the CLO itself, combine to create an asset class that has experienced lower losses than either equivalently rated corporate bonds or securitized products.


