
September 12, 2024 - The BDC Quarterly Wrap highlights select data points to provide a readout on BDC growth, structure, financing and asset quality. For context, growth data includes the entire BDC universe, which consists of 155 funds; all other data captures BDCs reporting financials by August 19th, representing a universe of 151 funds.
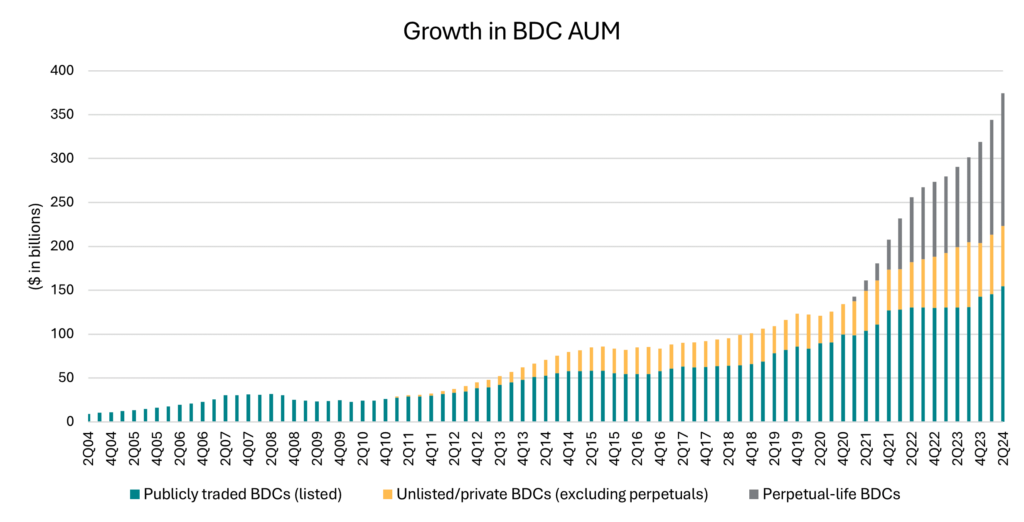
Market. In 2Q24, Business Development Companies’ (BDCs) assets under management (AUM) jumped 29% year-over-year and 9% consecutively to $375B, according to LSEG LPC’s BDC Collateral. The data is segmented into three cohorts: publicly traded BDCs, non-traded and private BDCs, and perpetual-life BDCs (i.e., non-traded BDCs with indefinite durations that offer shares continuously by recycling periodic share redemptions). The growth in 2Q was largely attributable to perpetual BDCs, which experienced a 66% YoY increase in AUM to $151.5B. This figure represents 34 funds, or 22% of the universe. The largest perpetual BDC, Blackstone Private Credit Fund, accounts for 39% of the perpetual BDC AUM.
Leverage. Fund-level leverage averaged 0.92x across all BDCs in 2Q24, down from 1.04x in 1Q24, according to BDC Collateral. For BDCs with more than $500M in total assets, leverage was flat at 0.97x on average in 2Q24 (down from 1x in 1Q24). Thirty-two percent of all BDCs were levered above 1x in 2Q24 (down from 40% in 1Q24). BDCs have issued $14.975B in unsecured debt year to date through September 6, 2024, up 566% (from $2.25B) year-over-year, according to Truist Securities.
Composition. The share of BDC portfolios comprising first-lien loans increased to 84.4% in 2Q24 from 82.8% in 1Q24, while the share of second-lien loans fell further to 4.0% from 4.9%, based on BDC Collateral data. The share of equities slipped to 8.1% from 8.9% in 1Q24.
Credit Risk. Net realized losses declined to $375M from $536M in 1Q24, BDC Collateral data shows. BDCs have reported net realized losses for the last eight quarters. Average non-accrual rates for public BDCs with more than $100M in total assets rose to 4.09%, up from 3.83% in 1Q24 and 3.72% in 2Q23. Adding private BDCs to the mix, the non-accrual rate was 1.66%, up from 1.36% in 1Q24. The weighted average share of last 12-months’ payment-in-kind (PIK) interest as a percentage of total investment income in BDCs was 6.54% in 2Q24, according to BDC Collateral. (Note that PIK data was not available across the entire BDC universe. As such, this figure includes 101 BDCs, or 65% of the universe.)
While this figure can reflect stress – it includes investments that have converted to PIK interest payments via amendment – it also reflects the flexibility characteristic of PCC because it includes investments that are structured with PIK interest optionality or with partial PIK interest at origination. According to a September 3rd Fitch Ratings report, the majority of PIK income reported in BDCs comes from such flexible structures for performing credits with good growth prospects. In these cases, borrowers are allowed to PIK a portion of interest for a period of time, often around two years. In 2Q24, new PIK investments accounted for 5.6% of new investments in BDCs, down from 6.27% in 1Q24, according to SOLVE.


