May 8, 2024 - After consecutive months of elevated inflation readings, the Federal Reserve placed its interest rate cuts on ice and markets recalibrated. The S&P 500 dropped 4.16% in April for its first negative return in 6 months, while Investment-Grade and High-Yield Bonds were set back 2.54% and 0.94%, respectively, according to Bloomberg Indices. Returns for broadly syndicated leveraged loans (BSL) also declined to their lowest level since October, but remained positive at 0.60%, driven by coupon clipping. Year-to-date, BSL returns stand at 3.07%, per the Morningstar LSTA Leveraged Loan Index (LLI), trailing the 5.57% return in the S&P 500, but ahead of the HY market’s 0.52% return.
Although loan returns were positive, April was the second time this year (after January) that the LLI’s price level declined. Advancers led decliners by a margin of 2:1, but prices peaked (96.76) at the beginning of the month before trailing off over the rest of April to close at 96.64. Average loan prices declined across 15 of the 22 trading sessions in April, translating to a loss of 0.16% in the LLI’s market value component of return, which was offset by 0.76% in return from interest income.
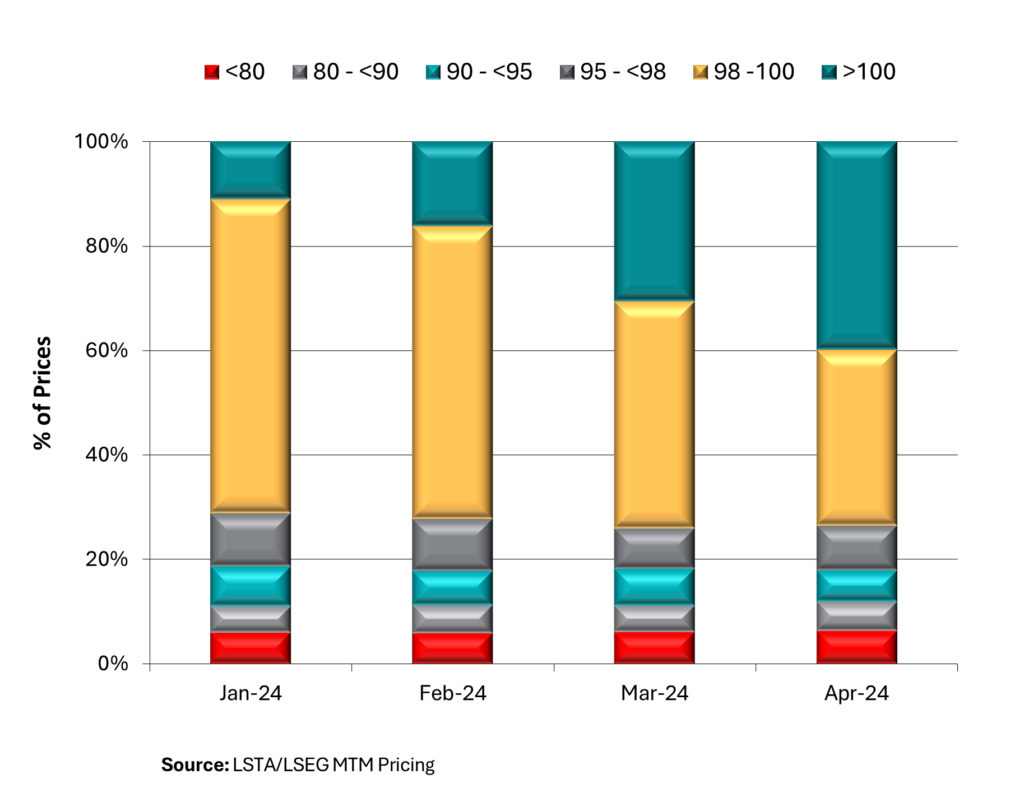
Despite the drop in average secondary marks, prices for highly bid loans remain elevated highlighting the technical tailwinds for loans in a higher for longer interest rate environment. For example, the share of loans marked above par increased 9% to 40% in April, the highest level since September 2018. In fact, a large swath of the secondary (73%) is bid at 98 or higher over the last two months. On the other side of the price spectrum, the share of loans priced below 80 held steady at 6%, with the share bid below 90 increased to 12% from 11%. Within these cohorts, the average price on loans bid 98 or higher increased to par, while the average price on loans bid less than 90 declined to 68.5, reflecting a bifurcation in the market between performing and struggling loans.

From a ratings perspective, this meant the riskiest loans underperformed in April. In contrast to the trend over the last 12 months, loans rated CCC lost 0.86% in April, but remain 4.46% higher YTD. While the price on the benchmark LLI dropped nine basis points in April, CCC loans fell 104 basis points to 81.40, with loans rated B- as well as B 10 basis points lower, and BB rated loans down only four basis points.
While there are pockets of stress in the market, they look contained and investor demand for loans remains robust and exceeds supply levels so far this year. First, on the demand side, CLO new issue picked up where it left off and added $16.9B in April, taking YTD volume past $65.2B, still on track for the strongest start to a year post-GFC.
Although that’s been offset by the high level of CLO amortization and liquidations resulting in $2B of net issuance YTD, according to Citi. At last week’s CLO conference, speakers noted that although loan spreads have tightened this year, the high demand for CLO paper has cut CLO funding costs making the arbitrage between them the most attractive in years. Part of the demand picture has been the emergence of retail demand in the form of CLOs ETFs, which have grown past $10B in AUM and climbing, as highlighted in a recent LSTA Member Spotlight.
Speaking of retail, high demand for traditional open end loan mutual funds and ETFs carried into April with $2.6B of inflows, per LSEG Lipper. This pushed YTD flows past $6.7B, the highest inflow since the Fed started raising interest rates two years ago. Together, visible demand from CLO and loan funds was nearly $20B in April and over $72B YTD, and while the institutional market grew $11.28B to $1.4T in April, as measured by outstandings in the LLI, it stands flat YTD as primary market activity has been focused on repricings, refinancings and extension amendments.


