April 4, 2024 - BSL loans returned 0.85% in March for a fifth consecutive positive month, per the Morningstar LSTA Leveraged Loan Index (LLI). Returns dipped six basis points from the previous month and lagged the average monthly return of 0.99% over the last 12 months, when loan returns reached the highest level since the Global Financial Crisis. Nevertheless, 1Q’s return was a robust 2.46%, driven by high investor demand and elevated interest rates. Loan returns trailed high-yield bonds’ 1.18% return in March but remain ahead year-to-date, according to the Bloomberg US Corporate High-Yield Index, as bond investors remain watchful of projected Fed interest rate cuts. The S&P 500 was 3.1% higher in March and rocketed to a return of 10.16% in 1Q.

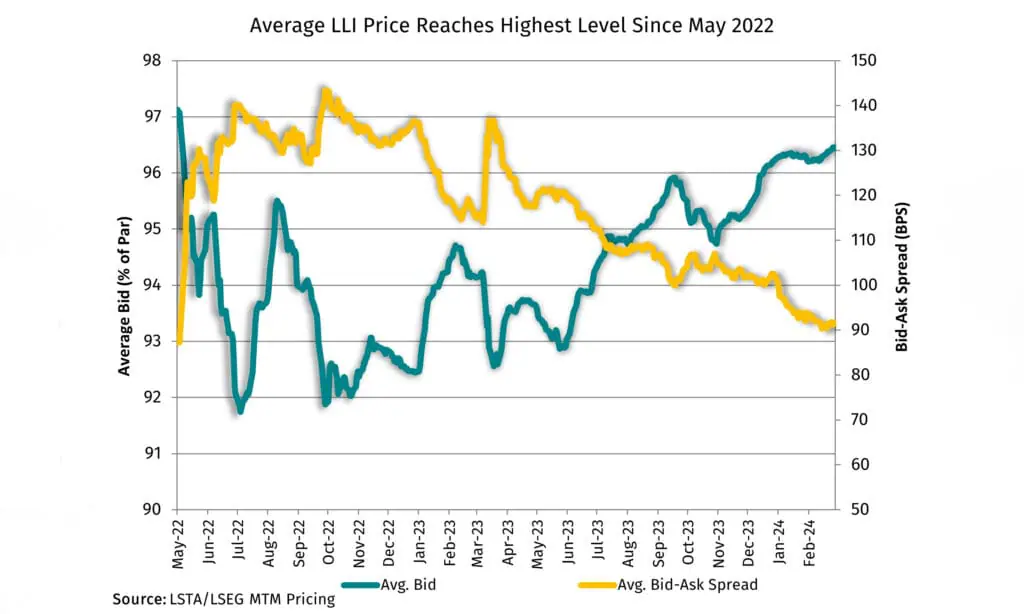
Delving deeper into performance, higher interest rates continue to drive total return. Elevated base rates contributed on average 0.79% a month so far this year, adding up to 2.34%, or 95% of the 2.46% of total return in the first quarter. By comparison, the interest component of return made up 70% of last year’s return. Aside from coupon clipping, high demand for loans pushed the average price on the LLI to 96.73 at the end of the quarter. Prices were up 28 and 50 basis points in March and 1Q, respectively, to the highest level since May 2022. But it was a mixed picture in the second half of the month after February’s inflation reading was higher than expected and loans declined in nine of 14 remaining trading sessions. Overall, 73% of loans advanced and 19% declined in March, pushing the share of the secondary market priced above par to 31%, the highest since December 2023. In fact, 74% of loans ended March priced 98 or higher, again the highest share since December. In turn, the average bid-ask spread tightened to 89 basis points.
And demand extended to the riskier segments of the loan market. CCC-rated loans returned 5.17% in 1Q and ended 245 basis points higher at 82.4, while B-rated loans, which make up 24% of the index, returned 2.6%. Higher quality BB-rated loans returned 2% compared to 2.46% for the LLI.
CLOs remained the predominant source of demand for loans. March activity slowed to $15.6B from a dizzying February when 42 deals priced for over $20B in volume. Year-to-date new issue CLO volume stands at $48.3B over 105 deals, or 41% higher year-over-year, representing the fastest start to the year and the second busiest quarter since the GFC. Away from CLOs, demand from retail investors has led to consistent flows into open-end mutual funds and ETFs. According to LSEG Lipper, flows have been positive and climbing for five months straight, with March’s $2.1B of inflows taking the first quarter total past $4B. This is the first time in two years that retail demand has returned in a meaningful way, after interest rate hikes by the Fed led to persistent outflows.
Combining CLO issuance and loan fund inflows, visible demand stood at $17.7B in March and over $52B in 1Q. Outstandings in the LLI declined $10.44B in March and the institutional market has contracted by $9.4B so far this year. Outstandings have declined in eight of the last 12 months, leading to a widening imbalance between supply and demand.
While the size of the institutional loan market shrank, high investor demand pushed refinancing and repricing activity to near record levels. January set the tone for the quarter with $165B of institutional lending, the bulk of which was refinancings and repricing amendments. After a slower February, March was again busy with $107B of lending. That adds up to $325B in institutional lending tracked by Pitchbook LCD, of which 83% was opportunistic. New money lending increased compared to last year but remained at a low level, especially compared to the level of demand.


